

Mastering A/B Testing – The Secret Weapon of Data-Driven Decision Making
Transform your business with data-driven experiments. Journey from basic A/B concepts to advanced strategies used by tech giants. Avoid common pitfalls and become a master of continuous optimizations.

Hello and welcome back to another thrilling episode of Tech Trendsetters, where we continue to explore the connections between the tech world, business strategies, and the concepts that drive innovation across industries. Today, we're taking a subject that sits right at the intersection of technology, business strategy, and data science: A/B testing.
Now, you might be thinking, "A/B testing? Isn't that just showing two versions of a website to see which one people like better?" If that's where your mind went, you're in for a surprise. We're about to uncover why A/B testing has become a critical tool for businesses in our data-driven world, far beyond simple design choices.
In one of the last episodes, we explored how AI is revolutionizing analytics across various sectors. Consider this a natural progression. We're taking that data-driven approach and applying it to every decision you make in your business. By the end of this episode, you'll see A/B testing for what it really is: a powerful method for making smarter, more informed choices that can dramatically impact your business performance.
Another day – another business strategy. Let’s get started!
The A/B Testing as Data-Driven Decisions for Business Success
Let's start with a simple facts: the days of making business decisions based on gut feeling alone are long gone. In our data-rich world, every click, every scroll, every millisecond of user attention is measurable. And where there's measurement, there's the potential for improvement.
Here we come to A/B testing.
At its core, A/B testing is a method of comparing two versions of something to determine which performs better. Sounds simple, right? But here's where it gets interesting – and where many businesses are leaving money on the table.
A/B testing isn't just about deciding between different page layouts or button colors. It's about creating a culture of continuous experimentation and improvement. It's about making decisions based on hard data rather than assumptions or HiPPOs (Highest Paid Person's Opinion).
Doing A/B testing well is harder than it looks. Much harder.
A key metric to keep in mind: A good benchmark for effectiveness is when 10-15% of your A/B tests bring statistically significant positive results. This might seem low, but it's actually a high success rate in the world of experimentation. Such a success rate can drive millions in additional revenue, making A/B testing a costly, but very effective tool.
A/B Testing Fundamentals
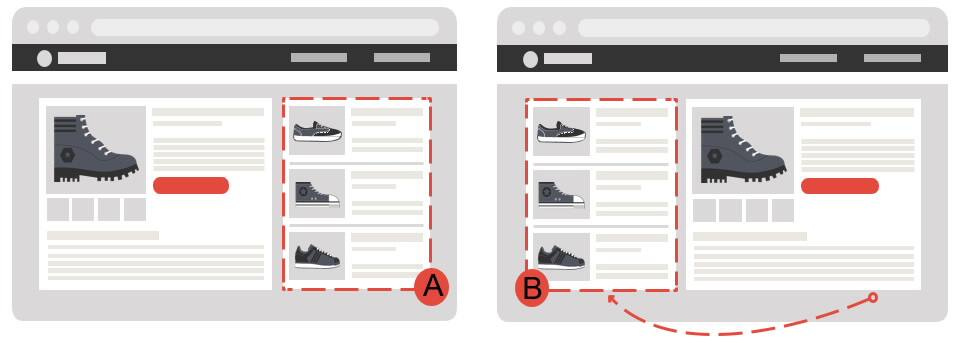
So, what exactly is A/B testing in a business context? At its simplest, it's a controlled experiment where two variants of a single variable are compared. But let's break it down further:
The Control (A): This is your current version – be it a webpage, an email campaign, or a product feature.
The Variant (B): This is the new version you want to test against the control.
You split your audience randomly between these two versions and measure which one performs better against your predefined business metrics. These metrics could be conversion rates, average order value, customer lifetime value, or any other KPI crucial to your business.
But why does A/B testing matter so much for businesses? Let's count the ways:
Risk Mitigation
Instead of rolling out changes to your entire customer base, you can test them on a small segment first. This reduces the risk of negative impacts on your bottom line.Continuous Improvement
A/B testing fosters a culture of ongoing optimization. Small, incremental improvements can add up to significant gains over time.Customer-Centric Decision Making
A/B testing puts your customers' behavior at the center of your decision-making process. You're not guessing what they want; you're observing what they actually do.ROI Maximization
By testing different strategies, you can identify which investments will yield the highest returns before committing significant resources.Competitive Advantage
In a world where margins are often thin, the ability to consistently optimize can be the difference between leading the market and falling behind.
Types of A/B Tests
While we often think of A/B testing in terms of optimization of business processes, its real applications are far more diverse. But before split into the specific use-cases, let's take a moment to appreciate the unique position A/B testing occupies at the intersection of three crucial domains:
Business: For companies, A/B testing is a strategic asset. It provides a systematic way to test hypotheses and measure the effectiveness of new features or strategies. In a world where gut feelings no longer cut it, A/B testing offers the hard data needed to make informed decisions.
Analytics (Statistics): This is where the science comes in. Analysts and data scientists play a crucial role in developing robust methodologies for conducting experiments. They're the ones selecting the right set of metrics, calculating the optimal duration of experiments, and determining the criteria for statistical significance. Without such expertise, A/B tests would be little more than guesswork.
Engineering: The tech side is the enabler. It provides the infrastructure necessary to conduct A/B tests at scale. This includes everything from the tools to split traffic and serve different versions, to the systems that collect and analyze data.
Now, with this context in mind, let's explore some of the main and most popular variations of testing approaches, though these are not all the methodologies available:
Classic A/B Testing
This is the straightforward comparison of two versions we've discussed. It's great for testing simple changes or when you have a clear hypothesis.
Multivariate Testing
This allows you to test multiple variables simultaneously. For example, you might test different combinations of headlines, images, and call-to-action buttons all at once. It's more complex but can yield deeper insights into how different elements interact.
Multi-Armed Bandit (MAB) Testing
This is a more advanced approach that uses machine learning algorithms to dynamically allocate traffic to better-performing variations during the test. It's particularly useful for situations where opportunity cost is high, like in e-commerce during peak shopping seasons.
Bayesian A/B Testing
Another advanced testing approach that provides a probability distribution for the effectiveness of each variant. This allows decision-makers to understand the likelihood that one version is better than the other and to update their beliefs as more data is collected. The result is a more intuitive and flexible for interpretation and informed decision-making.
Sequential Testing
Sequential testing is an advanced form of A/B testing that allows you to monitor your results continuously without inflating your false positive rate. The decision to stop the test is based on pre-defined criteria that are checked continuously. Ideal for scenarios where rapid decision-making is crucial. Given the importance and complexity of sequential testing, let's dive a bit deeper into some specific methodologies:
Group Sequential Tests (GST): This method allows for a predetermined number of interim analyses. It's particularly useful when data arrives in batches.
Always Valid Inference (AVI): This family of methods, including the Mixture Sequential Probability Ratio Test (mSPRT), allows for continuous monitoring with no predetermined stopping points.
It's important to understand that each of these methodologies comes with its own set of assumptions, strengths, and limitations. Moreover, this overview barely scratches the surface of the rich and complex field of A/B testing. Each of these methodologies has numerous variations and implementations.
As tech leaders and data enthusiasts, it's our responsibility to stay informed about these methodologies and their appropriate applications. But remember, the goal isn't to use the most complex method available – it's to choose the approach that best helps you make informed, data-driven decisions to improve your product and delight your users.
The A/B Testing From Hypothesis to Business Impact

Now, let's dive into the nitty-gritty of A/B testing. For all its power, A/B testing is a structured process that, when done right, can yield invaluable insights for your business and have great organizational impact. Let's break it down step by step.
Planning the Experiment
Every good A/B test starts with thorough planning. This is where you lay the groundwork for success – or failure.
Selecting metrics that matter first: what are you actually trying to improve? Clicks? Conversions? Response time? Customer Lifetime Value? The metric you choose will drive every other decision in your test.
Pro Tip: Don't just focus on surface-level metrics. Sure, click-through rates are easy to measure, but do they actually translate to business value? Sometimes, a decrease in one metric (like time spent on site) can actually indicate an improvement in user experience.
Formulating Hypotheses
This is where the science in "data science" really shines. A good hypothesis is specific, testable, and grounded in existing data or research. It's not just a hypothesis based on feeling – "I think red button will probably work better." It's hypothesis based on facts – "Based on our analysis of competitor sites and color psychology research, we hypothesize that changing our call-to-action buttons from blue to red will increase click-through rates by at least 5%."
Determining Sample Size and Test Duration

Here's where we get into some statistical concepts. Your sample size needs to be large enough to detect a statistically significant difference between your control and variant groups. This is where concepts like statistical power come into play.
Statistical Power: This is the probability that your test will detect an effect if there really is one. A true effect is a real, non-zero relationship between variables in a population. Typically, you want a power of at least 80%. This means that if there's a real difference between your control and variant, you have an 80% chance of detecting it.
To calculate the required sample size, you need to consider:
The baseline conversion rate;
The Minimum Detectable Effect (MDE) – the smallest improvement you care about;
Your desired significance level (usually 5%, or α = 0.05);
The desired statistical power (usually 80% or 90%);
There are multiple online calculators that can help with this, but understanding the underlying concepts is crucial for interpreting the results.
Preparing and Launching the Test
With your plan in place, it's time to get your test off the ground.
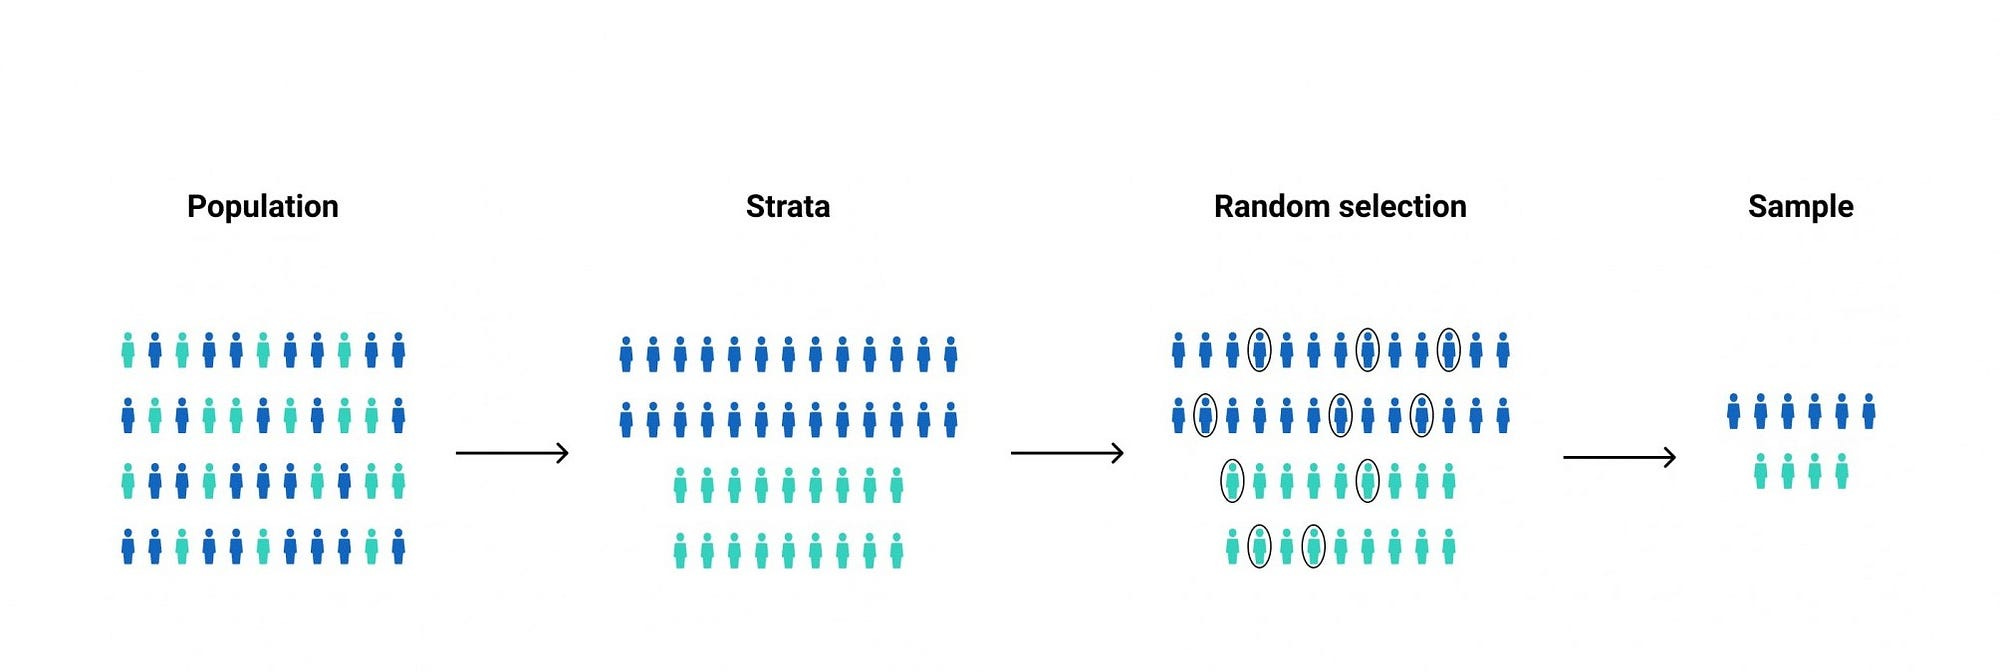
Dividing customers into groups with random assignment is key here. You want your control and variant groups to be as similar as possible in every way except for the change you're testing. This is where techniques like stratification can come in handy.
Stratification: This involves dividing your population into subgroups (strata) based on important characteristics before randomly assigning them to control or variant groups. For example, if you're an e-commerce site, you might stratify based on past purchase behavior to ensure you have a good mix of high-value and low-value customers in each group.
Next, ensuring test integrity is critical. Your test results are only as good as the data you collect. Make sure your tracking is accurate, that there's no "leakage" between groups (i.e., users in the control group shouldn't be able to see the variant), and that no other major changes are happening during your test period that could skew results.
Analyzing Results

The test is complete. Now comes the exciting, and often misunderstood part – interpreting the results. If you are somehow already familiar with A/B testing, you've probably heard terms “statistically significant” or “P-values” thrown around. But what does it actually mean?
Statistical Significance: The likelihood that the difference observed between control and variant groups is due to a real effect rather than random chance. It is a measure of whether the observed data deviates from what would be expected under a null hypothesis, which typically asserts that there is no effect or no difference.
P-value: The probability of observing results at least as extreme as those in your data, assuming that the null hypothesis (i.e., there's no real difference between the groups) is true. The p-value is a measure that helps determine the statistical significance of the observed data.
Typically, we use a significance level (α) of 0.05. If your p-value is less than this, we say the results are statistically significant. In other words, there's less than a 5% chance that you're seeing these results just due to random variation.
But here's a crucial point that many businesses miss: statistical significance doesn't necessarily mean practical significance. A 0.1% increase in conversion rate might be statistically significant if your sample size is large enough, but it might not be worth the cost of implementing the change.
Confidence Intervals: While p-values are useful, confidence intervals can often be more informative. A confidence interval gives you a range of plausible values for the true effect size. The interval has an associated confidence level that quantifies the level of confidence that the parameter lies within the interval.
For example, a 95% confidence interval of 2% to 8% for your conversion rate improvement means that if you ran this test many times, 95% of the time the true improvement would fall within this range.
This gives you a much better sense of the potential impact of your change than a simple "significant" or "not significant" result.
Interpreting Results for Business Impact
Here's where we bring it all back to business value. Once you've determined that your results are statistically significant and understood the likely range of the effect, you need to translate this into business impact.
What does a 5% increase in conversion rate mean in terms of revenue? How does it affect customer acquisition costs? What about long-term metrics like customer lifetime value?
And don't forget about opportunity costs. Even if your variant showed an improvement, is it the best use of your resources to implement it? Or could those resources be better spent elsewhere?
Let's walk through a real-world example to illustrate how tricky this can be:
Imagine you've run an A/B test on a new feature, and your testing platform has provided you with a distribution of results:
In 70% of cases, the metric improved by 1%;
In 20% of cases, there was no change;
In 10% of cases, the metric worsened by 7%;
At first glance, you might think, "Great! It improved in 70% of cases. Let's roll it out!" But not so fast. Let's do the math:
0.7 * 0.01 + 0.2 * 0 - 0.1 * 0.07 = 0The overall effect is... zero.
This is a perfect example of why understanding the full distribution of results is crucial. Despite the seemingly positive headline of "70% improvement," implementing this change doesn't make any business sense. It doesn't bring overall benefits and could even lead to losses when you factor in the costs of implementation.
So what do you do with results like these? This is where the real work begins. Your task now is to find ways to either reduce those 10% of cases where the metric worsened or increase the gains in the 70% where it improved. This might involve further segmentation of your data, tweaking your variant, or even going back to the drawing board with a new hypothesis.
The Pitfalls of Poor A/B Testing
I've seen it time and time again. A company gets excited about A/B testing, starts running experiments left and right, and then... nothing. No game-changing insights. No dramatic improvements in key metrics. Just a lot of wasted time and resources.
Why does this happen? Let's break it down:
The Peeking Problem: Imagine you're baking a cake. You've set the timer for 30 minutes, but after 10 minutes, you can't resist taking a peek. The cake looks done, so you take it out – only to find it's raw in the middle. A/B testing works the same way. Peeking at results too early can lead to false conclusions.
The Novelty Effect: Sometimes, a change performs well initially just because it's new and catches users' attention. But that effect can wear off quickly, leading to misguided decisions.
Ignoring Network Effects: In some businesses, especially platforms like ride-sharing apps or social networks, changes can have complex ripple effects that simple A/B tests might miss.
Poor Traffic Splitting: If you're not careful about how you divide users between your test groups, you can end up with skewed results that don't reflect reality.
Misunderstanding Statistical Significance: Just because a result is statistically significant doesn't necessarily mean it's meaningful for your business.
These pitfalls aren't just theoretical. In fact, for each problem above, you can find whole books written on the subject matter. We've seen companies make multi-million dollar decisions based on flawed A/B tests. The consequences can be devastating.
Advanced A/B Testing Strategies for Businesses
Now that we've covered the basics and potential pitfalls, let's dive into some advanced strategies that can take your A/B testing game to the next level. These approaches can help you extract maximum value from your testing efforts and drive real business growth.
In fact, A/B testing can be even more effective when combined with other methodologies that focus on understanding and modeling your business processes. One such complementary approach is Event Modeling, which we explored in depth in a previous episode:

Continuous A/B Testing
Remember when we talked about A/B testing fostering a culture of continuous improvement? Well, continuous A/B testing takes that idea to its logical conclusion. Instead of running discrete tests with clear start and end dates, some businesses are now embracing an always-on approach to experimentation.
Here's how it works: Rather than comparing a control version to a single variant, you're constantly testing multiple versions and iterating based on the results. It's like evolution in fast-forward – the fittest versions survive and reproduce, while the weaker ones are discarded.
This approach has several advantages:
You're not waiting for a test to conclude before making changes, allowing for rapid iteration. You can continuously refine and improve your variants.
As market conditions or user behaviors change, your testing can adapt in real-time.
Small improvements compound over time, leading to cumulative gains and significant long-term benefits.
But continuous A/B testing isn't without its challenges. It requires sophisticated infrastructure, robust analytics capabilities, and a team that can manage and interpret a constant stream of data. It's not for the faint of heart, but for businesses that can pull it off, the rewards can be substantial.
Iterative Testing Approaches
While continuous testing might be the holy grail, many businesses can benefit from a more structured iterative approach. This strategy involves running a series of related tests, each building on the insights from the last.
For example, let's say you're an e-commerce company looking to improve your checkout process. You might start by testing different layouts for your checkout page. Once you've found the winning layout, you could then test various copy for your call-to-action buttons. After that, you might experiment with different upsell offers at checkout.
Each test informs the next, creating a virtuous cycle of improvement. This approach allows you to tackle complex problems in manageable chunks, while still maintaining the rigor of proper A/B testing.
Balancing Efficiency and Learning
One of the trickiest aspects of advanced A/B testing is striking the right balance between exploitation and exploration – or as I like to call it, the "efficiency vs. learning" dilemma.
Here's the issue: Once you find a winning variant, it's tempting to immediately roll it out to 100% of your users. After all, that's going to maximize your short-term gains, right? But by doing so, you might be missing out on even better variants that you haven't discovered yet.
This is where techniques like the multi-armed bandit come into play. These algorithms dynamically allocate more traffic to better-performing variants while still reserving some traffic for exploration of new variants.
But even without fancy algorithms, you can apply this principle to your testing strategy. Instead of always running 50/50 split tests, consider running some tests with a 90/10 split. The 90% goes to your current best-known version (maximizing efficiency), while the 10% tests a new variant (continued learning).
The key is to think long-term. Sure, you might sacrifice some short-term gains, but the insights you gain could lead to much bigger wins down the line.
Personalized A/B Testing
Here's another mind-bending thought: What if the best version of your website is different for every single user?
That's the premise behind personalized A/B testing. Instead of finding a single "best" version, you're identifying which versions work best for different user segments or even individual users.
This approach recognizes that user preferences and behaviors can vary widely based on factors like demographics, past behavior, or even the time of day. By tailoring your A/B tests to these segments, you can uncover insights that would be lost in a one-size-fits-all approach.
For instance, a travel website might find that users from different countries respond better to different types of imagery or copy. Or a B2B software company might discover that the optimal onboarding flow differs based on the user's role or company size.
Implementing personalized A/B testing requires advanced analytics capabilities and often involves machine learning algorithms to identify and target relevant user segments. But for businesses that can crack this nut, the potential for improved user experiences and increased conversions is enormous.
The Power of Micro-Conversions
While it's tempting to focus A/B tests solely on your primary conversion goals – be it purchases, sign-ups, or downloads – savvy businesses are increasingly paying attention to micro-conversions.
Micro-conversions are smaller actions that users take on the path to your main conversion goal. These might include adding items to a wishlist, watching a product video, or engaging with a chatbot.
By running A/B tests on these micro-conversions, you can gain insights into user behavior at every stage of the funnel. This allows you to optimize the entire user journey, not just the final conversion point.
Moreover, focusing on micro-conversions can help you run more tests, more quickly. You'll often see statistically significant results faster for these smaller actions, allowing for rapid iteration and learning.
Remember, every optimization of a micro-conversion compounds. A 3% improvement in add-to-cart rate, combined with a 1% improvement in progression to checkout, and a 2% improvement in final purchase conversion can add up to a substantial boost in overall revenue.
Common Pitfalls and How to Avoid Them: The Advanced Edition
Earlier, we touched on some of the basic pitfalls of A/B testing – the peeking problem, novelty effects, and misunderstanding statistical significance. These are the traps that many businesses fall into when they're just starting out with A/B testing. But as you advance in your testing journey, you'll encounter a whole new set of challenges. Let's explore these more sophisticated pitfalls and how to navigate around them.
The Multiple Testing Problem
Remember when we talked about the excitement of running tests left and right? Well, there's a hidden danger lurking in that enthusiasm. It's called the multiple testing problem, and it's a statistical beast that can devour your results if you're not careful.
Here's the idea: Every time you run a test, there's a small chance you'll see a "significant" result just by random chance. If you're using the standard 5% significance level, that chance is... 5%. But if you run 20 tests, suddenly the probability of seeing at least one false positive jumps to 64%!
This is why some companies proudly announce they've found a winning variant, only to see no real-world impact when they implement it. They've fallen victim to the multiple testing problem.
How to avoid it? There are a few strategies:
Use correction methods like Bonferroni or Benjamini-Hochberg to adjust your significance levels;
Plan your tests in advance and limit the number you run simultaneously;
Always validate your results with follow-up tests before making major changes;
The Segment Trap
In our last segment, we talked about the power of personalized A/B testing. But there's a dark side to this approach – over-segmentation.
It's tempting to slice your data into ever-smaller segments. "Let's look at male users aged 24-26 in urban areas who visited us on a Tuesday!" But the more you segment, the smaller your sample sizes become, and the less reliable your results.
Moreover, you risk falling into the multiple testing problem we just discussed. If you test enough segments, you're bound to find some that show "significant" results purely by chance.
The solution is to use segmentation reasonably. Start with broad segments and only drill down when you have a clear hypothesis and enough data to support it. And always be skeptical of results from very small segments.
The Local Maximum Problem
Here's a counterintuitive pitfall: sometimes, relentless optimization can actually hold you back. This is known as the local maximum problem.
Imagine you're trying to climb a mountain in dense fog. You can only see a few feet around you, so you keep walking uphill. Eventually, you reach a point where any step in any direction takes you downhill. Great! You've reached the peak, right?
Not necessarily. You might just be on a small hill, with a much higher peak hidden in the fog.
A/B testing can lead to a similar situation. By constantly making small optimizations, you might reach a point where small changes no longer yield improvements. But that doesn't mean you've reached the best possible outcome – you might be stuck at a local maximum.
To avoid this, you need to occasionally take big, bold steps. Test radically different strategies or designs. It might lead to short-term decreases in performance, but it could also help you discover entirely new peaks to climb.
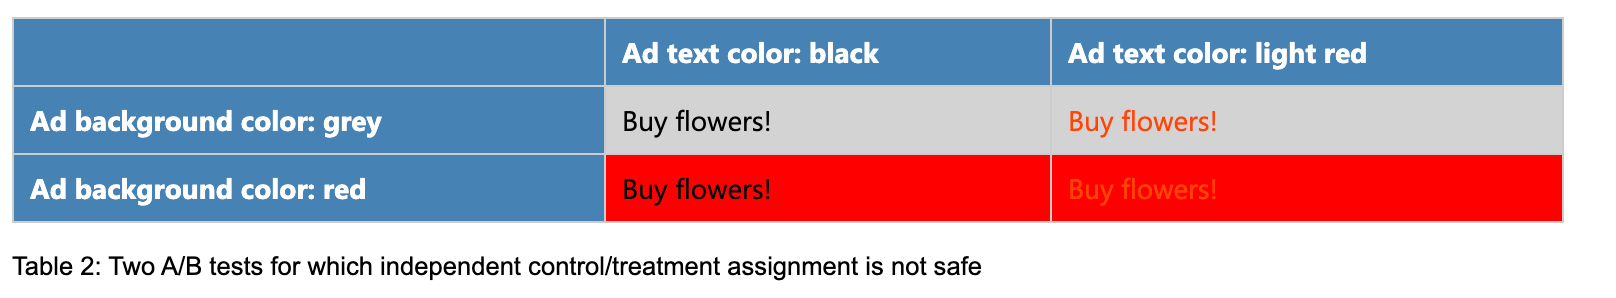
The Interaction Blindness
As we push into more advanced A/B testing territory, we often find ourselves testing multiple changes simultaneously. This is where interaction effects come into play – and where many businesses stumble.
Interaction effects occur when the impact of one change depends on the presence or absence of another change. For example, changing your website's color scheme might have one effect on its own, but a completely different effect when combined with a new layout.
Traditional A/B testing can miss these interactions entirely. You might conclude that neither change is effective on its own, missing the fact that they're powerful when combined.
The solution is to use more advanced experimental designs like factorial experiments or multivariate testing. These approaches allow you to test combinations of changes and uncover these hidden interaction effects.
The Extrapolation Error
Here's a painful lesson many businesses learn the hard way: success in an A/B test doesn't always translate to success at scale.
Maybe your new feature worked great for a small test group, maybe your new feature worked great for a larger test group, but when you roll it out to your entire user base, it falls flat. Or perhaps your amazing conversion rate boost disappears when you try to replicate it in a different market.
This extrapolation error can occur for various reasons:
Network effects that only become apparent at scale;
Differences in user behavior across markets or segments;
Resource constraints that weren't evident in the small-scale test;
To mitigate this risk, consider:
Gradually rolling out changes, monitoring for any drop-off in effectiveness;
Testing in multiple markets or segments before a full launch;
Continuously analyzing user feedback and performance metrics to adjust strategies promptly
Ensuring your test sample is representative of the broader user base
Collaborating closely with cross-functional teams to identify and address potential scale-up issues
These mitigation techniques might seem obvious, but they're crucial to keep in mind. The common wisdom often hides the most impactful practices. Careful planning and systematic testing can significantly enhance the chances of successful extrapolation and implementation on a larger scale.
The Metric Myopia
Last but not least, let's talk about a pitfall that can sneak up on even the most sophisticated A/B testers: metric myopia or when the optimization blinds you.
It's easy to get caught up in optimizing for a specific metric – click-through rate, conversion rate, average order value. But sometimes, in our zeal to move that needle, we lose sight of the bigger picture.
For instance, you might run a series of tests that successfully increase your short-term conversion rate. Great news, right? But what if those changes are actually hurting customer satisfaction and long-term retention?
To avoid this, always consider the broader impact of your changes. Monitor a range of metrics, not just your primary KPI. And most importantly, never lose sight of your overarching business goals and user experience.
Real-World A/B Testing: Lessons from Spotify's Experimentation Platform
Now that we've dived deep into the world of A/B testing, let's zoom out and look at how these concepts play out in the real world. And who better to learn from than large companies like Netflix or Spotify, companies that have a large customer base and conduct large-scale experiments?
Spotify's engineering team recently published a fascinating blog post detailing their approach to sequential testing. Their insights offer us a perfect case study to understand how theory translates into practice when you're running experiments that can affect millions of users.
The Spotify Approach – Group Sequential Tests
Spotify's choice of sequential testing framework might surprise you. Despite the many other more popular and convenient options available, Spotify opted for the tried-and-true group sequential testing (GST). Why? Because sometimes, the old ways are the best ways – especially when they align perfectly with your infrastructure.
Remember when we talked about the importance of understanding your data delivery system? Well, Spotify's data infrastructure delivers data in batches, typically once a day. This setup dovetails beautifully with GST, which was originally designed for medical studies where data arrived in – you guessed it – batches.
But let's break down why Spotify finds GST so appealing:
One of the standout features of GST is its use of alpha-spending functions. This approach allows Spotify to decide on the fly whether they're ready to peek at the results or if they'd rather wait. If they choose not to peek, the test gracefully converges to a traditional z-test. It's like having your cake and eating it too – you get the benefits of sequential testing without sacrificing the simplicity of traditional methods when you don't need them.
In the world of data science, being able to explain your methods to non-technical stakeholders is almost as important as the methods themselves. GST shines here because, at its core, it's just a series of z-tests. This familiarity makes it easier for Spotify's data scientists to communicate their findings across the organization.
Perhaps most importantly, Spotify's simulations showed that GST consistently outperformed other methods in terms of statistical power when dealing with batched data. In the high-stakes world of product development, where every percentage point of improvement can translate to millions in revenue, this power advantage is crucial.
Of course, no method is without its drawbacks. Spotify's team is upfront about the challenges they face with GST:
GST requires an estimate of the maximum sample size an experiment will reach. If this estimate is off, it can lead to either an underestimated or overestimated false positive rate. For a company like Spotify, with its vast and variable user base, accurate estimation can be tricky.
Choosing the right alpha-spending function is critical, especially when you're unsure about your final sample size. A poorly chosen function can lead to underpowered tests, potentially missing important effects.
GST starts to struggle when you need to peek more than a couple hundred times. For most of Spotify's experiments, which typically run for a few weeks, this isn't an issue. But for longer-running tests, it could become a limitation.
The Spotify verdict, based on their thorough analysis, concluded that for their specific needs – batched data delivery, experiments typically lasting a few weeks, and a premium on statistical power – GST was the optimal choice.
They emphasize that this choice is specific to their circumstances. They acknowledge that for companies with different data infrastructures or experimental needs, other methods like always valid inference (AVI) might be more appropriate.
Lessons for the Rest of Us
So, what can we take away from Spotify's R&D team about sequential testing?
Solid experimentation practices ensure valid risk management. This is crucial for businesses as it allows them to be bold in their ideas while limiting the risk of making poor product decisions. By carefully controlling false positive and negative rates, companies can manage the risks of shipping changes that don't have a positive impact on user experience, or missing out on shipping changes that do.
The choice of testing framework should align with the data delivery system. Batched data? GST might be the best bet. Streaming data? Consider alternative methods like AVI.
In product development, the ability to detect small but meaningful effects can make or break experiments. Methods that maximize statistical power should be chosen based on the specific setup.
The ability to peek at results without inflating the false positive rate is crucial for agile development. Make sure your chosen method allows for this flexibility.
The importance of being able to explain methods to non-technical stakeholders should not be underestimated. Sometimes, a slightly less powerful but more intuitive method might be the right choice for an organization.
What works for Spotify might not work for you. Always consider specific needs, infrastructure, and team capabilities when choosing a testing framework.
Spotify's approach to A/B testing exemplifies how data-driven decision making can be a powerful tool for business growth and innovation. By carefully selecting and implementing the right testing framework, companies can not only improve their products but also manage risks, maximize ROI, and ultimately stay ahead.
TLDR;

Here's the thing I want you to take away from today's episode: You probably came into this thinking, "Yeah, yeah, A/B testing, I know what that is. Been there, done that." And you know what? You're not wrong. Most of us in the tech world have heard about A/B testing, maybe even playing around with it a bit.
But if you've ever tried to really implement it, to make it a core part of your decision-making process, you know it's not a walk in the park. It's like the difference between knowing how to play chess and actually becoming a grandmaster. The concept is simple. The execution – that's where things get tricky.
And that's exactly what we've unpacked today. We've peeled back the layers of A/B testing to reveal the complex, nuanced beast that it truly is. From the basics of setting up an experiment to the advanced strategies employed by tech giants.
So, let's zoom out and place A/B testing in the broader context of causal analysis methods. Here are the key takeaways from our research:
A/B testing idea isn't about deciding between UI layouts – it's a powerful tool for creating a culture of continuous experimentation and data-driven decision making.
Mastering A/B testing is critical for business success in our data-rich world, where every click, scroll, and millisecond of user attention is measurable.
Advanced strategies like continuous testing, personalized A/B testing, and focus on micro-conversions can take your experimentation game to the next level.
Beware of common pitfalls like the multiple testing problem, over-segmentation, and the local maximum problem. Learn from other people's mistakes.
Real-world implementation, as we saw with Spotify, requires aligning your testing framework with your specific infrastructure and needs. One size definitely doesn't fit all in the world of A/B testing.
The reality of A/B testing is that most of the conducted experiments don't yield significant results.
Let me elaborate on the last point. Companies naturally don't see significant results in about 90% of their A/B test experiments. If this sounds disappointing, it shouldn't. In fact, it's completely normal and even expected:
If most of your experiments were successful, it would be an easy game for everyone. The reality is that finding the right successful hypothesis takes a lot of effort.
A high success rate in your experiments is often a red flag. If you're seeing positive results in most of your tests, it's a clear sign that something might be wrong with your testing methodology or interpretation of results.
Remember, these are called "experiments" for a reason. Like in any scientific research, many hypotheses don't play out. That's part of the process.
The few successful experiments often reward the business many times over for all the effort spent. These big wins compensate for all the "failed" tests and drive significant growth.
But here's the good news, folks: A/B testing, as powerful as it is, is just one tool in the causal analysis toolkit. It's like having a really good hammer – fantastic for nails, but not so great for screws. That's where other methods come into play, which we may cover in one of our next episodes:
Counterfactual methods shine in complex cases where classic A/B tests might fall short. But remember, with great power comes great responsibility – ensure your model application is robust!
When you can't run a pilot with a control group, methods like causal impact analysis come into play. These techniques allow for evaluation of effects without the need for a traditional control group, offering flexibility in scenarios where A/B testing isn't feasible.
Pro tip: it's always tempting to bypass either the A/B testing as a whole in favor of simpler techniques, or to skip the initial A/B planning design and extrapolation methodology. Don't! Implementing without proper planning or relying solely on causal impact for evaluation leads to inconsistent results. Your evaluations won't line up, and you'll be left scratching your head, wondering where it all went wrong.
As we close up this episode, keep this simple idea: A/B testing is a mindset. It's about embracing uncertainty, challenging assumptions, and letting data guide your decisions.
Take Formula 1 racing, for example. The sport has undergone a revolution in recent years, all thanks to the accessibility of big data. Teams now run thousands of simulations during each race, testing different strategies, car setups, and even pit stop timings in real-time. They're essentially running massive A/B tests as the cars speed around the track. This data-driven approach has completely transformed how races are won, turning gut feelings into scientifically-backed decisions.
Whether you're a startup founder, a product manager, a data scientist, or a Formula One driver, mastering A/B testing can be your secret weapon.
Until next time, keep experimenting, keep learning, and keep pushing the boundaries of what's possible (as they say at Apple). This is Tech Trendsetters, signing off!
🔎 Explore more: